Bristol: Opportunities & Challenges
Temple Quarter Regeneration & Sustainable Transport
From industrial port to Green Capital - examining urban transformation, inequality, and regeneration
Opportunities
Cultural Mix
- • 90+ languages spoken
- • St Paul's Carnival (50,000+)
- • 1,000+ restaurants (50+ cuisines)
- • Multicultural festivals year-round
Recreation & Entertainment
- • Bristol Old Vic (UK's oldest working theatre, 1766)
- • Trip-hop birthplace (Massive Attack)
- • Banksy street art capital
- • Balloon Fiesta (500,000 visitors)
Employment Opportunities
Total: 256,000 jobs (+25,000 in decade)
- • Aerospace: Airbus (4,000), Rolls-Royce (3,500)
- • Tech/Creative: 50,000 jobs (Aardman, BBC)
- • Finance: HSBC, Lloyds (4,000+)
Key Statistics:
- • Unemployment: 3.2% (UK: 4.1%)
- • 60,000 university students
- • 40% graduates stay in Bristol
- • Salaries: £35-60k (aerospace/tech)
Integrated Transport Systems
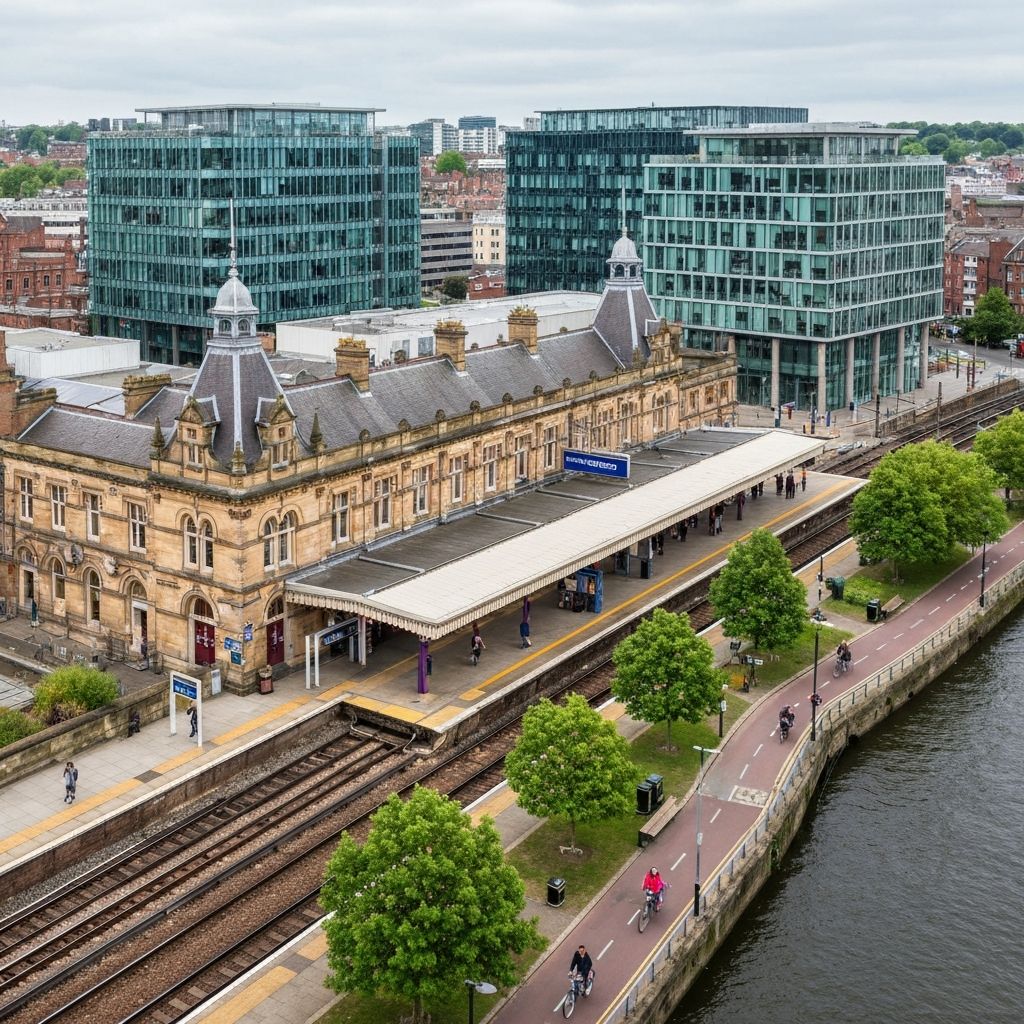
- • Temple Meads: 11M passengers/year
- • MetroBus: 4M journeys/year
- • 300km cycle routes
- • 3 Park & Ride sites (2,000 spaces)
- • 8% cycle modal share (3rd in UK)
- • MetroWest rail expansion planned
European Green Capital 2015
First UK city awarded this prestigious status
Key Green Spaces:
- • Ashton Court: 850 acres (country estate)
- • Brandon Hill: Oldest park (1174)
- • River Avon Trail: 37km walking/cycling
Green Economy:
- • 9,000 low-carbon jobs (target 17,000 by 2030)
- • 12% homes have solar panels (UK avg: 5%)
- • 50+ community gardens
Challenges
Extreme inequality: Bristol has 6 of England's 10% most deprived neighbourhoods (South Bristol) but ALSO some of England's least deprived (North/West Bristol). Adjacent areas can be at opposite extremes.
Most Deprived Areas:
Least Deprived Areas:
Affordability Crisis:
- • Average house: £380,000 (UK: £290,000)
- • Affordability ratio: 10.7x salary (UK: 8.3x)
- • Need £85,000+ salary to buy average home
Consequences:
- • 82 rough sleepers (2023 count)
- • 14,000 waiting for social housing
- • 15% overcrowded in Lawrence Hill
Urban Sprawl
325 hectares farmland lost (2010-2020), commuter settlements growing (Portishead: 3,000→26,000)
Brownfield vs Greenfield
2,000+ homes needed/year. Brownfield cleanup costs £10-50k/plot. Greenfield easier but destroys countryside.
Waste Disposal
250,000 tonnes/year, 30% recycling contaminated, 5,000+ fly-tipping incidents/year
Air Pollution
NO₂ exceeded limits on 6 roads, Clean Air Zone introduced 2022
Urban Regeneration: Temple Quarter
Why Regeneration Was Needed:
- • 72 hectares derelict brownfield land
- • Contaminated soil (industrial chemicals)
- • Unsafe buildings (squatters, drug use)
- • Cut off communities (physical barrier)
- • 12%+ unemployment in surrounding wards
- • Eyesore visible from arriving trains
Main Features of the Project:
Enterprise Zone (2012)
100% business rates relief for 5 years, fast-track planning
Housing: 10,000 homes
30% affordable, 1,200 completed, 2,500 under construction
Jobs: 22,000 target
7,000 created so far, tech/creative focus
University Campus
£300M, 3,000 students, robotics/quantum research
Transport
£120M Temple Meads upgrade, MetroBus M3 line
Investment
£1.6 billion total (17:1 ratio public to private)
Successes
- • 400+ companies relocated
- • 7,000 jobs created (on track)
- • Brownfield land transformed
- • Contamination cleaned up
Challenges
- • Only 12% homes built (behind schedule)
- • "Affordable" still £250,000
- • Only 12% jobs to local deprived wards
- • Gentrification concerns
Overall Score: 7/10 - MIXED SUCCESS
Economic/environmental success, social goals underachieved
Transport Strategies to Reduce Congestion
1. Clean Air Zone (2022)
What:
- • £9/day charge for diesel cars
- • £100/day for HGVs/buses
- • Electric/hybrid exempt
Results:
- • 8% fewer diesel vehicles
- • NO₂ dropped 12%
- • £12M revenue for public transport
2. MetroBus (Bus Rapid Transit)
What:
- • 3 routes (M1, M2, M3)
- • Dedicated lanes (30km)
- • Traffic light priority
- • Cost: £230 million
Results:
- • 4 million journeys/year
- • 30% faster than regular buses
- • 95% on-time (vs 75% regular)
3. Cycling Infrastructure
Infrastructure:
- • 300km cycle routes
- • Bristol-Bath Railway Path (21km)
- • UK's first "Cycling City" (2008)
Results:
- • 8% modal share (3rd in UK)
- • 50,000 regular cyclists
- • Target: double by 2030
4. Park & Ride
Sites:
- • Portway (800 spaces)
- • Long Ashton (1,200 spaces)
- • Brislington (400 spaces)
Benefits:
- • Free parking + £3 bus
- • Removes 500+ cars/day
- • 80% cheaper than city parking
Overall Success: 6/10 - MODEST
Working:
- • Air quality improved
- • Cycling increased 60%
- • 6% fewer cars entering center
Still Challenges:
- • Still 3rd most congested
- • 54% commute by car
- • No trams/underground
Fieldwork: Environmental Quality Survey (EQS)
An Environmental Quality Survey (EQS) is a fieldwork technique used to assess environmental quality using observer judgment against measurable indicators. EQS provides quantitative data to compare areas like regenerated Cabot Circus vs declining Broadmead.
For full EQS methodology, see Paper 3 Section 3.4Survey Design:
- • 10 indicators: Buildings, Pavements, Graffiti, Litter, Greenspace, Boundaries, Traffic, Pollution, Street Furniture, Noise
- • Scoring: Bipolar scale -2 to +2
- • Max score: +20 per location | Min: -20
Fieldwork Conditions:
- • Sample: 5 locations per area
- • Time: 11am-2pm (consistent)
- • Weather: Dry, partly cloudy, 14°C
- • Method: Pairs scored independently, averaged
Cabot Circus
Regenerated (£520M, 2008)
| Location | Score |
|---|---|
| 1. Quakers Friars | +13 |
| 2. The Circus | +12 |
| 3. Philadelphia St | +12 |
| 4. Penn Street | +8 |
| 5. Harvey Nichols | +13 |
Broadmead
Non-regenerated (1950s, declining)
| Location | Score |
|---|---|
| 1. Main Street | -2 |
| 2. Union St (M&S) | -8 |
| 3. Merchants Road | -6 |
| 4. Horsefair | -13 |
| 5. Castle Street | +5 * |
* Anomaly: adjacent to Castle Park
(41% of the -20 to +20 scale)
1. £520 million investment (2008)
Modern buildings, quality materials, professional landscaping → Buildings +2.0, Pavements +1.8
2. Active management
Dedicated cleaning staff observed working, security guards deter vandalism → Graffiti +1.8, Litter +1.2
3. Economic vitality
>95% shop occupancy, 17.5M visitors/year = landlords invest in upkeep
4. Award-winning design
BREEAM Excellent certification, natural ventilation, landscaped public spaces
1. Disinvestment since 2008
M&S closed 2021, Debenham's 2020, 20-30% vacancy rate → Buildings -0.8 (boarded windows, peeling paint)
2. Antisocial behavior
Rough sleeping, drug use, vandalism → Graffiti -1.0 (extensive tagging), Pollution -1.0 (urine smell)
3. Council budget cuts
Reduced street cleaning, bin emptying → Litter -1.0 (overflowing bins), Pavements -0.2 (cracks)
4. 1950s-70s brutalist design
Concrete-dominated, lacks greenery, dated appearance → Greenspace -0.6
5. Vicious cycle
Poor environment → fewer visitors → retailers close → less maintenance → worse environment → repeat
Displacement Effect
Cabot Circus success (500m away) directly contributed to Broadmead's decline. Regeneration created winners AND losers within the same city centre - not balanced urban improvement.
Castle Park Anomaly
Only positive Broadmead score (+5) was location adjacent to Castle Park. Greenspace +2, Noise +1 - parks buffer urban decline.
Trade-offs in Success
Even Cabot Circus has weaknesses: Noise -0.2, Pollution +0.2from popularity (crowds, traffic, music from stores).
Describe the method used to conduct an Environmental Quality Survey. [4 marks]
Explain why environmental quality was higher in Cabot Circus than in Broadmead. [6 marks]
Evaluate the usefulness of Environmental Quality Surveys for investigating urban regeneration success. [9+3 marks]
Grade 8/9 Analysis
Bristol exemplifies the paradox of successful cities: economic growth (tech boom, Green Capital status) coexists with persistent spatial inequality. Temple Quarter regeneration shows how brownfield redevelopment can transform derelict areas BUT risks gentrification and fails to reach local deprived communities. Transport strategies show incremental success but Bristol remains car-dependent - radical measures (congestion charge, car-free zones) may be needed. The key exam skill is linking opportunities and challenges: growth creates jobs BUT increases housing demand → affordability crisis → deprivation.
Test Your Knowledge
Question 1 of 7
Temple Quarter has created 7,000 jobs on 135 hectares of regenerated brownfield land. This is an example of:
Exam Practice
Evaluate the success of urban regeneration in Bristol. Use evidence from Temple Quarter. [9 marks]