Bristol: Location, Importance & Migration
South West England - European Green Capital 2015
8th largest city in England, fastest-growing outside London, first UK European Green Capital
500,300
Population (2025)
8th
Largest UK City
11.4%
Growth 2014-24
90+
Languages Spoken
Location & Geography
Region: South West England
Coordinates: 51.45°N, 2.58°W
River: River Avon (flows through city center)
Distance from London: 190km (120 miles) west
Coast: 12km from Bristol Channel/Severn Estuary
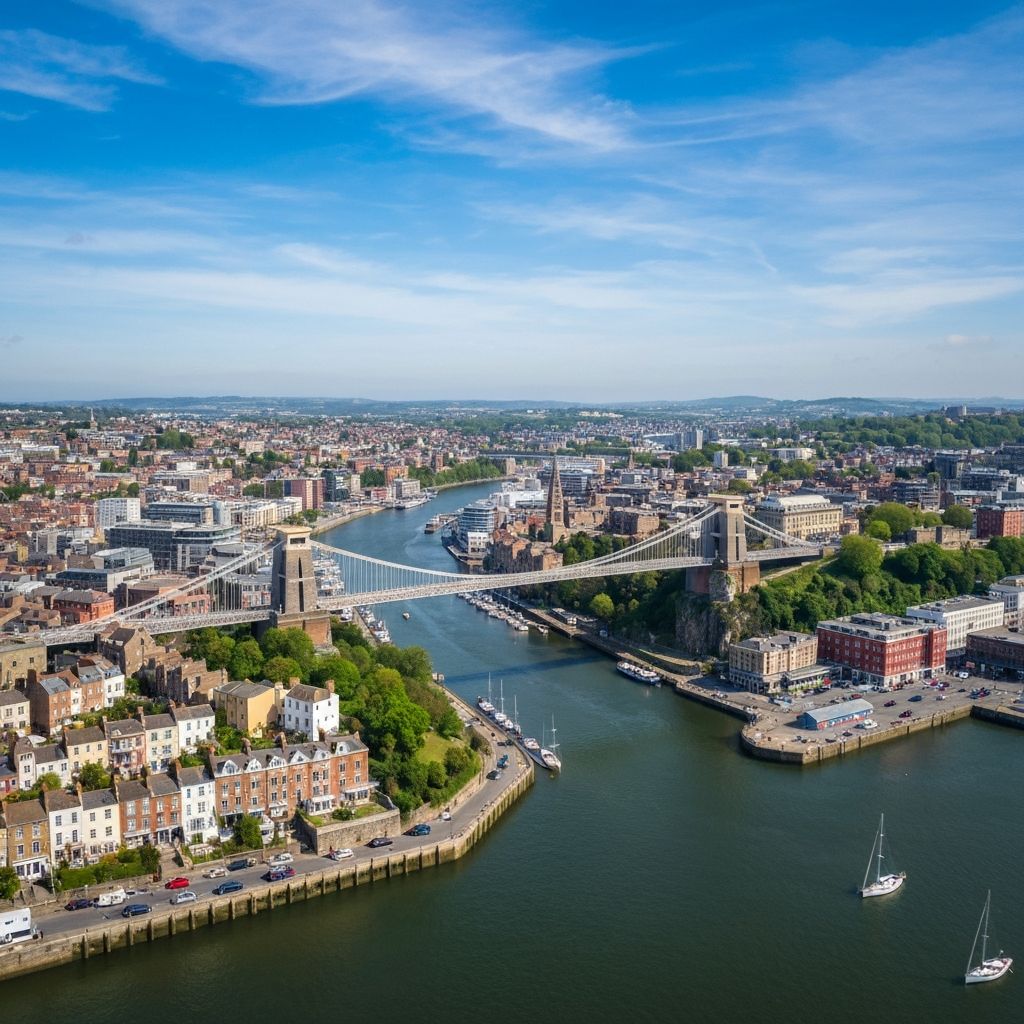
Topography: Built on 7 hills, Avon Gorge with Clifton Suspension Bridge
M4/M5 junction: Connects London, Wales, Midlands, South West
Bristol's Importance
West of England Combined Authority
- Core city: Centre of metropolitan area (1.14 million)
- Neighboring areas: South Gloucestershire, Bath, North Somerset
- Regional economy: £39 billion GVA
- Status: Largest city in South West England
- Employment: 23,000+ businesses, largest employer concentration in South West
Population Growth
Key trend: 11.4% growth over decade (2014-2024) - England & Wales average was only 7.6%. Bristol growing 50% faster than national rate. 2nd fastest growing Core City (after Manchester 13.5%).
Causes of Population Growth
2022-2023 Figures:
- • 15,434 moved to Bristol from overseas
- • 5,364 left Bristol for overseas
- • Net gain: +10,070
Why Bristol attracts migrants:
- • Universities (60,000 students, 9,000+ international)
- • Employment (aerospace, tech, NHS)
- • Quality of life (green city, culture)
- • Post-Brexit: Non-EU now dominant (India, China, Nigeria)
2022-2023:
- • 41,305 arrived from other UK areas
- • 44,919 left for other UK areas
- • Net loss: -3,614
Why people leave:
- • Housing unaffordable (avg £380,000)
- • Families priced out to suburbs
- • Remote working → rural relocation
Why positive: Median age 32.9 years (England avg: 40.7) - universities attract young people, many stay after graduation.
Ethnic Diversity & Cultural Mix
Key change: White British declined from 77.9% (2011) to 64.4% (2021) = -13.5 percentage points. Bristol is rapidly diversifying through international migration.
Key Communities:
Caribbean (2.6%)
St Paul's area - since 1950s Windrush generation
African (3.3%)
Recent growth - Somalia, Nigeria, Zimbabwe
Pakistani (1.9%)
Easton, Lawrence Hill areas
Polish (8,000+)
Largest EU group - arrived 2004-2019
Impact of Migration on City Character
Cultural Vibrancy
St Paul's Carnival (50,000+ attendees), Diwali, Eid, 1,000+ restaurants (50+ cuisines)
Language Diversity
90+ languages in schools - children grow up multilingual
Economic Contribution
20% of businesses minority-owned, 30% NHS staff born overseas, £120M+/year contribution
Innovation
International students bring diverse perspectives, startup founders from global backgrounds
Integration Issues
Some areas segregated (Easton 40% Asian), language barriers for older migrants
Pressure on Services
15% pupils need EAL support, NHS translation costs £500K+/year
Housing Pressure
Increased demand contributes to affordability crisis
Cultural Tensions
Occasional tensions, generational divides in integration
Bristol's approach: Official "City of Sanctuary" for refugees - celebrates diversity as policy, but challenges exist in balancing integration with community identity.
Bristol's growth is driven by international migration (70%+ of growth) rather than internal migration (net loss) or natural increase. This has transformed Bristol from a historically industrial port city to a multicultural, tech-focused, green city. However, benefits are unevenly distributed - migrant communities contribute economically but face integration challenges, while housing affordability pressures push existing residents to surrounding areas.
Test Your Knowledge
What percentage of Bristol's population growth comes from international migration?
Exam Practice
Explain how international migration has changed the character of Bristol. [6 marks]