Global Food Supply & Demand Patterns
Understanding global food security, production patterns, and the impact of changing diets
8B+
Global population
2,100
WHO min kcal/day
828M
People hungry (2023)
7:1
Grain:beef ratio
Food Secure
People have reliable access to sufficient, safe, nutritious food to meet their dietary needs for an active, healthy life.
Food Insecure
Cannot reliably access adequate food. Risk of hunger, malnutrition, and related health problems.
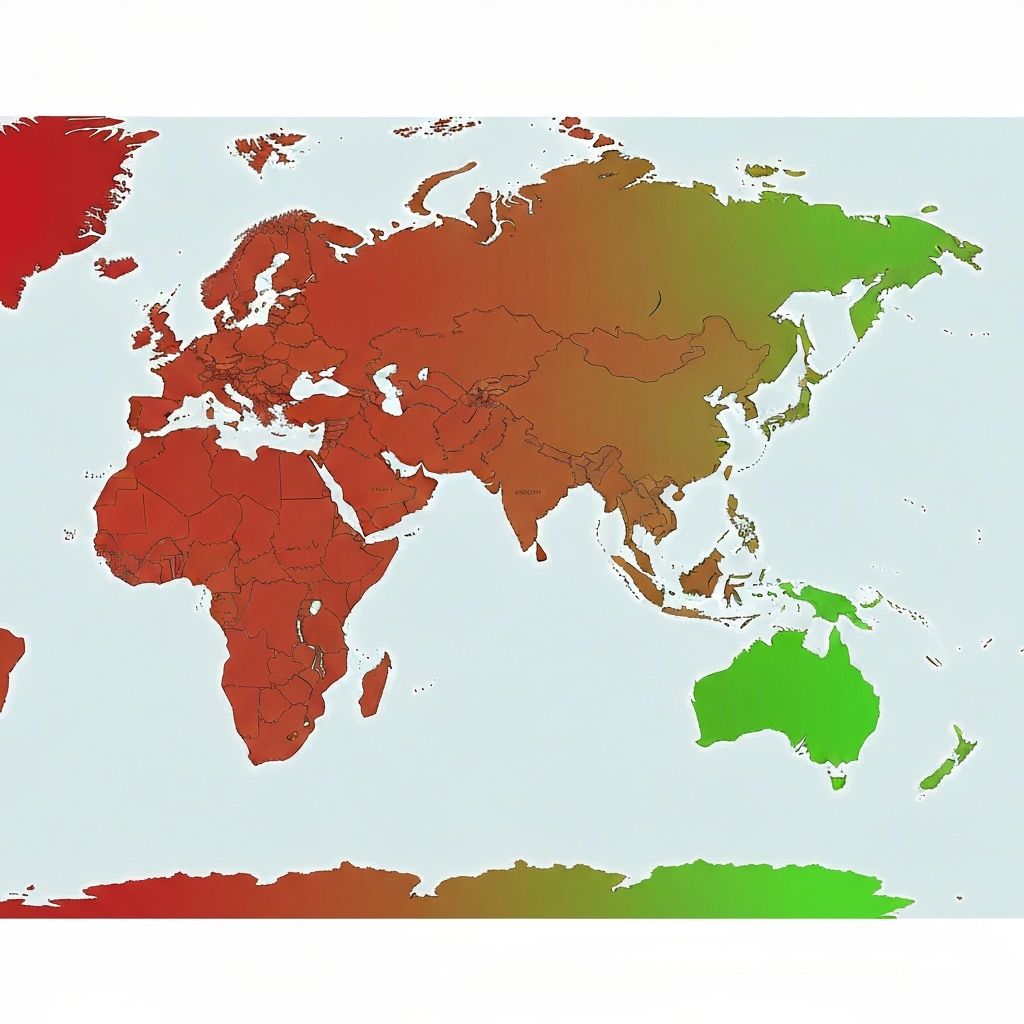
Surplus Regions (Food Secure):
North America
USA = world's largest grain exporter. Wheat, maize, soy. Reasons: Fertile prairies, mechanized farming, technology, subsidies.
Europe
Barley, wheat, meat, dairy. Reasons: Moderate climate, fertile soils, CAP subsidies, advanced technology.
Asia
Largest producer globally (rice, sugar, meat). China, India dominate. Reasons: Large workforce, monsoon irrigation, intensive farming.
South America
Soy, beef, coffee, sugar. Brazil, Argentina major exporters. Reasons: Tropical climate, Amazon clearance, large plantations.
Deficit Regions (Food Insecure):
Sub-Saharan Africa
Produces LESS than consumed, relies on imports/aid. Reasons: Poor soils, unreliable rainfall, limited technology, conflict, poverty, disease.
Middle East / North Africa
Desert climate = limited agriculture. Imports grains. Water scarcity major constraint.
Click a country to see food security data
United States
Food Secure3,700
kcal/person/day
Wheat, Maize, Soy
Reasons for Status:
- •Fertile prairies
- •Mechanized farming
- •Advanced technology
- •Government subsidies
World's largest grain exporter
EXCESS - obesity epidemic
Rising as incomes grow
BELOW WHO minimum - food insecure
As incomes rise in NEEs (China, India, Brazil), diets shift from traditional grain-based to Western-style meat-heavy diets:
Traditional LIC/NEE Diet
- • Rice, grains, vegetables (staples)
- • Minimal meat consumption
- • Low environmental impact
Westernized Diet
- • More meat (beef, chicken, pork)
- • More dairy, processed foods
- • Higher sugar and fat content
Why This Matters:
7 kg of grain needed to produce just 1 kg of beef. As meat demand rises, grain demand MULTIPLIES. China's meat consumption doubled 2000-2020 → soy imports from Brazil skyrocketed → Amazon deforestation accelerated.
Drag the slider to see how rising incomes changed food consumption
65 kg
per person per year
110M
tonnes per year
450M
people (can afford meat)
62M
hectares for soy
The Connection:
Rising incomes → Growing middle class → More meat consumption → More grain needed for animal feed → More soy imports from Brazil → More Amazon deforestation
See how much grain is needed to produce meat
70 kg
Grain needed
10 kg
Beef produced
Water Footprint:
154,000 litres
That's 1027 bathtubs of water for 10 kg of beef
Why This Matters:
As global meat demand rises (especially beef), grain demand multiplies by 7x. This drives deforestation for cropland and increases water stress in farming regions.
1. Population Growth
- • 8 billion (2023) → 10 billion by 2050
- • Most growth in LICs/NEEs (Africa, Asia)
- • More mouths to feed = rising demand
2. Economic Development
- • NEEs industrializing = rising incomes
- • China: 400M+ middle class
- • Higher purchasing power → more meat
See how population growth affects food security by region
1.20B
0.80B equiv.
-0.40B
2.00B
1.80B equiv.
-0.20B
0.40B
0.20B equiv.
-0.20B
0.65B
0.90B equiv.
+0.25B
1.50B
1.60B equiv.
+0.10B
0.75B
1.00B equiv.
+0.25B
0.38B
0.80B equiv.
+0.42B
Key Insight:
By 2050, Sub-Saharan Africa's population will nearly double while food production grows slowly. The food gap widens most in regions that are ALREADY food insecure.
Key Insight: It's Not About Production
Global food production is SUFFICIENT to feed 8 billion+ people. The problem is DISTRIBUTION and ACCESS, not supply.
Food insecurity is caused by:
Poverty
Can't afford food even if globally available
Conflict
War disrupts production and distribution
Poor Infrastructure
Can't transport food to remote areas
Inequality
Distribution favors wealthy countries
Question 1 of 6
Which region is the world's largest grain exporter?
Explain why food insecurity exists in Sub-Saharan Africa despite global food production being sufficient to feed the world's population. (6 marks)