Classifying Development & Measuring Quality of Life
Understanding how we measure and compare development across countries
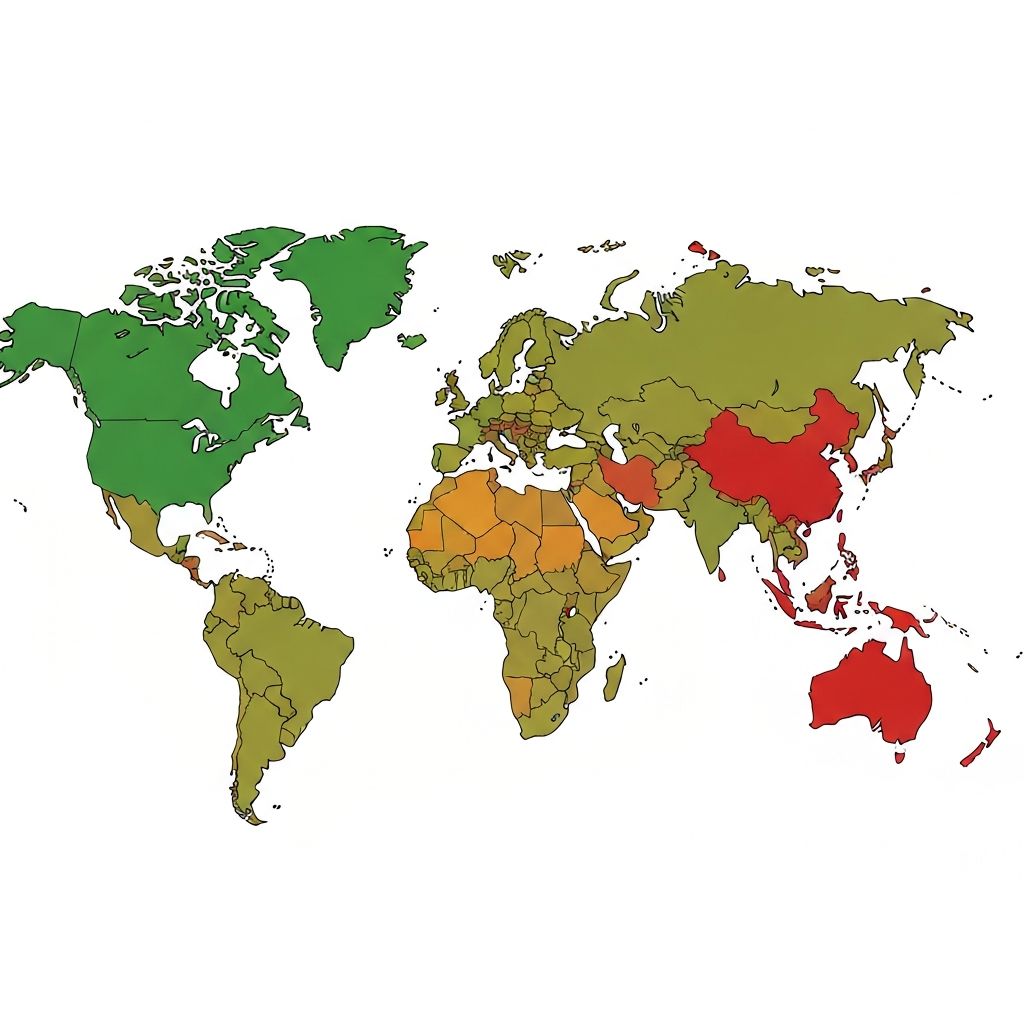
Countries are classified into three main categories based on their level of economic and social development:
High Income Countries
Wealthy, industrialized, high living standards
Examples: UK, USA, Japan, Germany
Newly Emerging Economies
Rapidly industrializing, rising incomes, transitioning
Examples: China, India, Brazil, Nigeria
Low Income Countries
Poor, agricultural economies, low living standards
Examples: Chad, Somalia, Afghanistan
Development Level
GNI per capita
Definition: Total income of country ÷ population
HIC
$40,000+
NEE
$4-12k
LIC
<$1,000
Limitation: Doesn't show wealth distribution - Qatar GNI $130,000+ but migrant workers earn little
GDP (Gross Domestic Product)
Definition: Total value of goods/services produced in country
Similar to GNI but measures production within country borders only.
Limitation: Same as GNI - doesn't show distribution or quality of life
Social indicators measure quality of life factors beyond just wealth:
Birth Rate
Births per 1,000 pop/year
⚠ Influenced by culture/religion
Death Rate
Deaths per 1,000 pop/year
⚠ Aging HIC populations = misleading
Infant Mortality
Under-1 deaths per 1,000 births
⚠ Underreporting in remote areas
Life Expectancy
Average years expected to live
⚠ Affected by conflict/epidemics
People per Doctor
Population ÷ doctors
⚠ Doctors concentrated in cities
Literacy Rate
% who can read/write
⚠ Definition varies by country
The HDI is a composite measure that combines three dimensions:
Income
GNI per capita
Health
Life expectancy
Education
Years of schooling
HDI Scale: 0.0 (lowest) to 1.0 (highest)
<0.55
Low (LIC)
0.55-0.70
Medium
0.70-0.80
High (NEE)
0.80+
Very High (HIC)
Highest: Norway 0.957
Lowest: Niger 0.394
HDI Advantages: Broader picture than single indicator (includes wealth, health, education)
⚠ Still limited: Doesn't capture inequality, gender disparities, or environmental sustainability
Critical for Grade 8/9: Understand why NO SINGLE MEASURE is perfect
Averages hide inequality
GNI per capita doesn't show if wealth is concentrated in elite - average masks reality for majority
Data reliability
LICs lack resources for accurate data collection - informal economy not counted, remote areas underreported
Cultural bias
Some indicators reflect Western values - literacy less relevant in oral cultures, GDP ignores subsistence farming
Doesn't capture well-being
Measures growth but not happiness - Bhutan uses 'Gross National Happiness' as alternative
Environmental impact ignored
High GNI countries often have high carbon footprints - sustainability not measured
Grade 8/9 Key Point
No single measure is perfect. Composite measures (HDI) are better than single indicators but still limited. Top answers use MULTIPLE indicators and explicitly recognize their limitations when assessing development. Always evaluate which measure is most appropriate for the specific context.
Click an indicator to see definition, values, advantages, and limitations
GNI per capita
Total income of country ÷ population
HIC
$40,000+
NEE
$4,000-12,000
LIC
<$1,000
Advantages
- +Shows average wealth
- +Easy to compare countries
- +Standardized measure
Limitations
- −Doesn't show wealth distribution (inequality hidden)
- −Doesn't measure quality of life
- −Informal economy not counted in LICs
Real-World Example
Qatar GNI $130,000+ but migrant workers earn very little
Classify the country as HIC, NEE, or LIC based on its indicators
GNI per capita
$45,000
Life Expectancy
82 years
Literacy Rate
99%
Infant Mortality
4 per 1,000
Adjust the sliders to see how indicators affect the Human Development Index
Human Development Index
0.745
High (HIC/NEE)
Income Index
0.80
Life Index
0.77
Education Index
0.67
Plot different indicators to see correlations and outliers
Look for: General correlation (do points cluster in a line?), outliers (countries that don't fit the pattern), and development level clustering (do HICs, NEEs, LICs group together?).
A country has GNI per capita of $130,000 but limited rights for migrant workers. What does this show about using GNI as a development measure?
Explain why GNI per capita is a limited measure of development. Suggest an alternative measure that overcomes some of these limitations. (6 marks)