Issue Evaluation Skills
Master the 5 essential skills for interpreting pre-release resources and making evidence-based decisions
Skill 1: Map Interpretation
Map Skills Tested
Distribution Patterns
- • Concentrated - features grouped together
- • Dispersed - spread out evenly
- • Clustered - bunched in specific areas
- • Sparse - few features present
Technical Skills
- • Grid references: 4-figure (square) vs 6-figure (point)
- • Scale: 1:50,000 → 2cm = 1km
- • Contours: Close = steep, far = gentle
- • Compass directions: N, NE, E, SE, S, SW, W, NW
Model Answer Technique
"Wind farms are concentrated along Scotland's western coastline, particularly in the northwest. Offshore wind farms cluster in the North Sea east of Aberdeen. The distribution reflects suitable locations with stronger, more consistent winds (referenced in Figure 3 wind speed data)."
Question 1 of 4
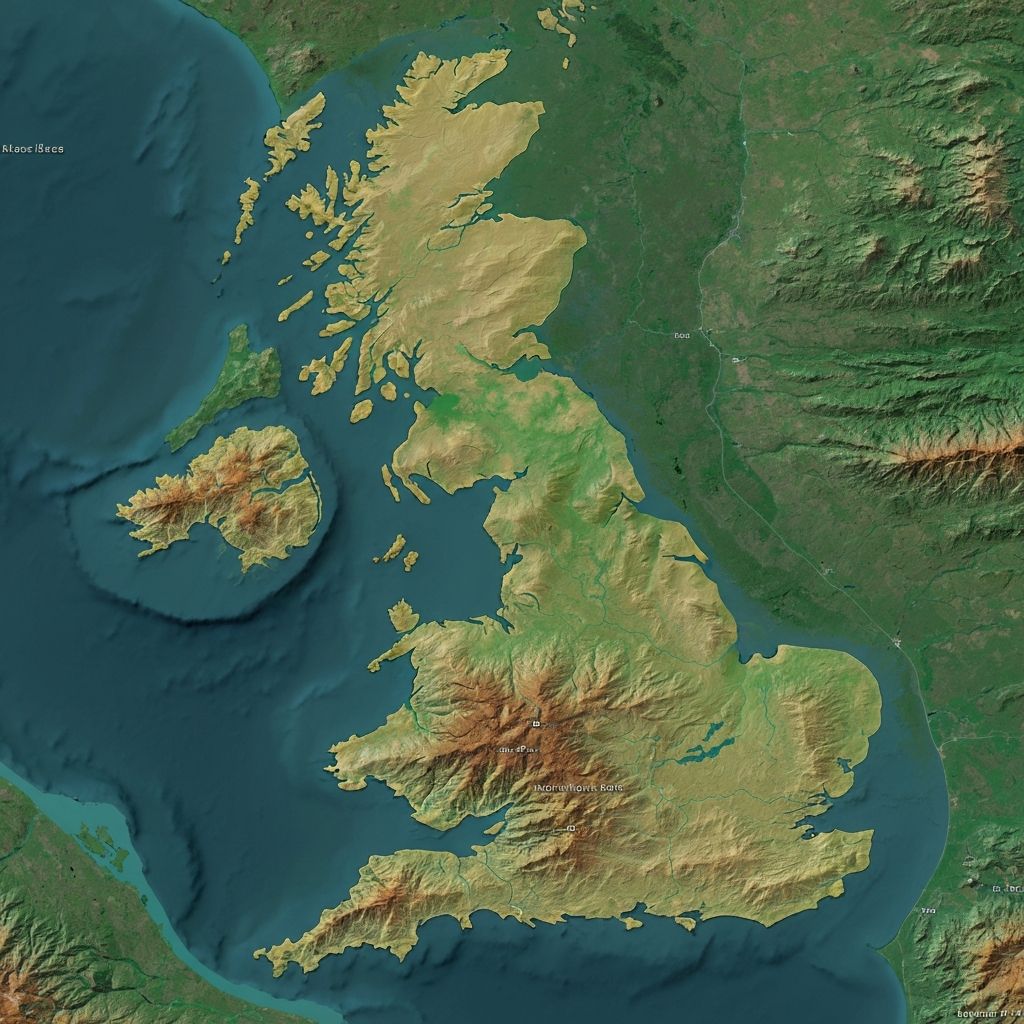
Describe the distribution of wind farms shown in this map extract.
Skill 2: Graph & Chart Analysis
What to Identify
- • Overall trend: Increasing/decreasing/stable
- • Specific values: Quote exact numbers
- • Rate of change: Steep = rapid change
- • Anomalies: Points that don't fit pattern
Percentage Change Formula
(New - Old) / Old × 100
Example: (75-15)/15 × 100 = 400% increase
Learn what to look for in each graph type
Line Graph: What to look for
- Overall trend (increasing/decreasing/stable)
- Peaks and troughs (when?)
- Rate of change (steep = rapid)
- Anomalies (unexpected points)
Example: Carbon emissions 1990-2020
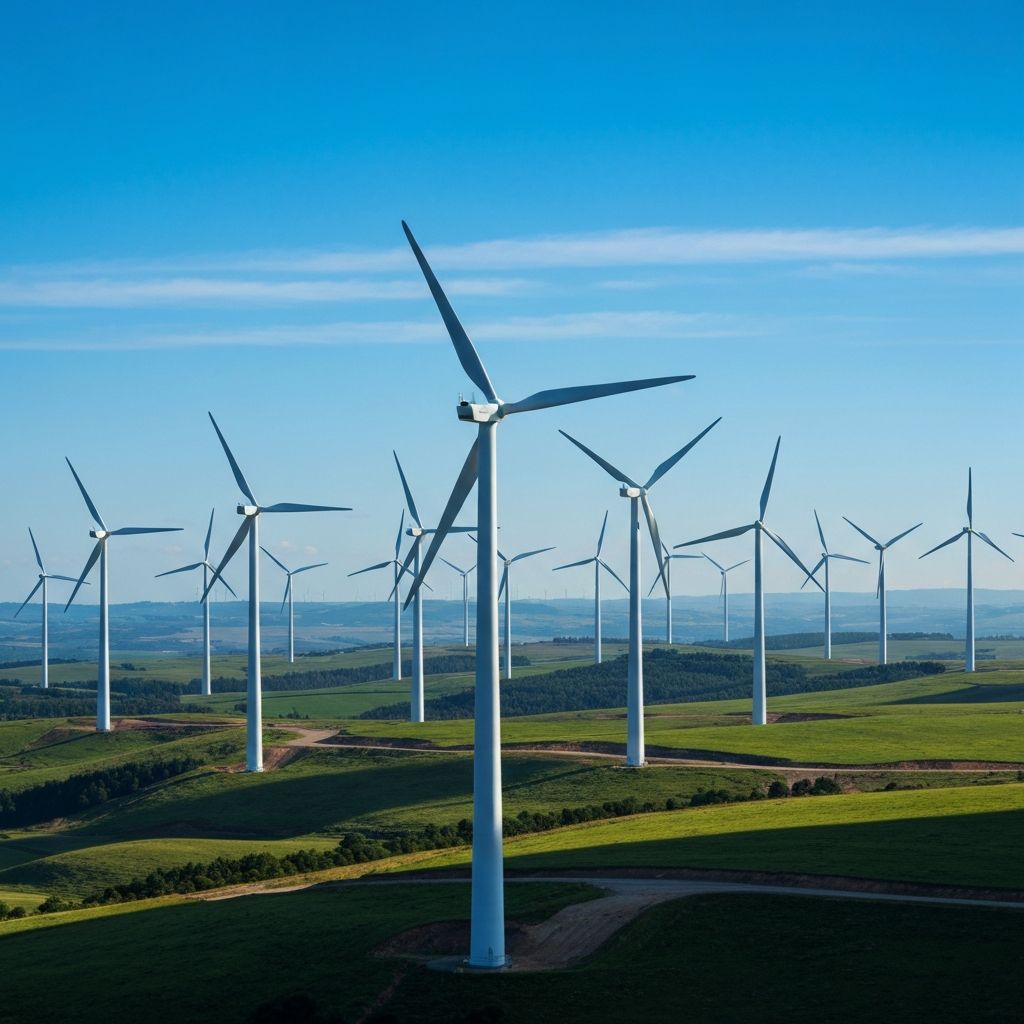
Skill 3: Photo Interpretation
Physical Features
Landforms, vegetation, water bodies, topography
Human Features
Buildings, roads, infrastructure, land use
Evidence of Processes
Erosion, urbanization, pollution, change over time
Annotation Technique
Label specific features → Write evidence ("This shows... because...") → State impact (What effect does it have?)
Click features in the wind farm photo to identify and annotate them
Skill 4: Stakeholder Analysis
Common Stakeholders
Local residents
Quality of life, property values, jobs
Environmental groups
Conservation, biodiversity, climate
Businesses/developers
Profit, growth, employment
Government/councils
Balance interests, regulations
Scientists/experts
Data-driven analysis, feasibility
Key Analysis Technique
For each stakeholder: (1) Identify their priority, (2) Find evidence supporting their view, (3) Find evidence contradicting their view, (4) Understand their motivations (financial? environmental? personal?)
Stakeholder 1 of 6
Wind Farm Developer says:
"The wind farm will create 200 construction jobs and generate £10 million annually for the local economy."
What is this stakeholder's PRIMARY focus?
Skill 5: 9-Mark Decision Making
Mark Scheme Breakdown
Level 1 (1-3 marks)
Simple statements, little evidence, unclear decision
Level 2 (4-6 marks)
Some evidence, basic analysis, limited justification
Level 3 (7-9 marks)
Multiple figures, different perspectives, clear justified decision
+ 3 marks for SPaG (spelling, punctuation, grammar)
Build your answer step-by-step
Introduction
State your decision clearly in 1-2 sentences
Example:
I believe Location B is most suitable for the wind farm because it offers the best balance of economic, environmental, and social factors.
Tips:
- ✓Be decisive - don't sit on the fence
- ✓Mention the key criteria you'll use
- Use at least 4-5 different figures in 9-mark answers
- Integrate economic, social AND environmental perspectives
- Quantify where possible - use specific data, not vague terms
- Link to specification knowledge - explain processes, not just describe
- Acknowledge complexity: 'While X suggests..., Y indicates..., on balance...'
- Build chains of reasoning: 'This leads to... which results in... therefore...'
- Not stating a clear decision (sitting on the fence)
- Listing advantages without evidence from figures
- Only considering one perspective (ignoring social/environmental)
- Copying chunks from booklet without explaining relevance
- Not referencing figure numbers
- Poor SPaG - costs up to 3 marks
Question 1 of 5
What should be the FIRST thing you do when analyzing a graph in the pre-release?
Using Figure 4 (graph of tourism growth) and Figure 5 (map of safari lodges), explain why tourism has increased in Kenya's national parks. (4 marks)