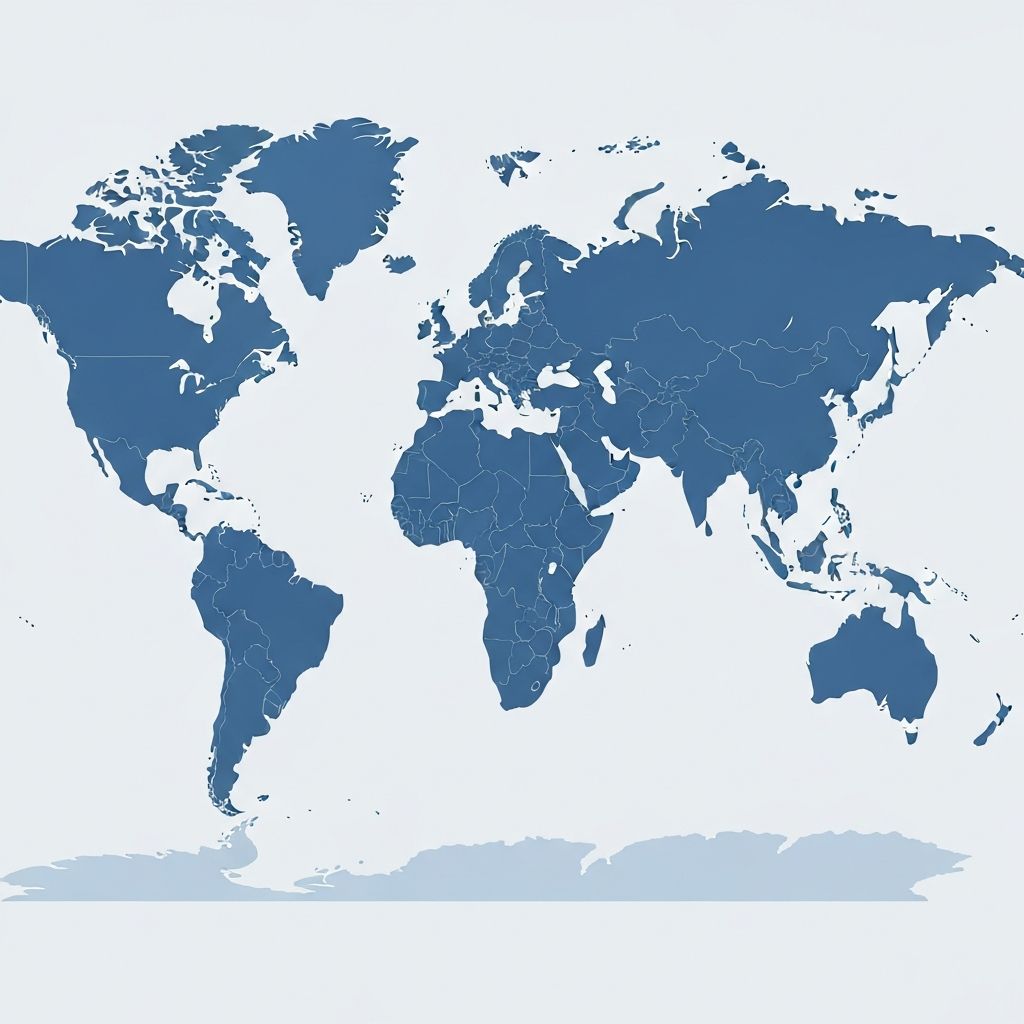
Global Urbanisation Trends & Megacities
Understanding why cities grow and how urbanisation differs across HICs, LICs, and NEEs
55%
World Urban (2020)
68%
Projected by 2050
33
Megacities (2020)
43+
Projected by 2030
What is Urbanisation?
Urbanisation = the increasing percentage of a population living in urban areas (towns and cities)
% Urban Population
Urbanisation by Development Level
HICs
80%+ urban already
Urbanised early (1800s Industrial Revolution)
Growth now slow/stable
Some counter-urbanisation (people move to rural areas)
NEEs
40-70% urban
Rapid industrialisation NOW
Growth very rapid
China, India, Brazil - megacity emergence
LICs
20-40% urban
Urbanising rapidly NOW
Growth fastest globally
Urban population doubling every 10-15 years in some countries
Why Do People Move to Cities?
PUSH Factors (Rural)
Things that push people AWAY from rural areas
- →Agricultural mechanisation = fewer farm jobs
- →Lack of services (schools, hospitals far away)
- →Natural disasters (drought, flooding)
- →Poverty and limited opportunities
PULL Factors (Urban)
Things that pull people TOWARDS cities
- ←Employment (manufacturing, services)
- ←Better wages than rural work
- ←Services (education, healthcare)
- ←Perception of better quality of life
Analyse the conditions and predict migration likelihood
Rural Conditions (PUSH)
- •Severe drought destroyed crops
- •Nearest hospital 50km away
- •Average wage $2/day
Urban Conditions (PULL)
- •New textile factory hiring
- •Free primary school
- •Average wage $8/day
What is the migration likelihood?
Scenario 1 of 4
Natural Increase in Cities
Why Cities Grow Without Migration
- 1. Young adults (20-30 years) migrate to cities for work
- 2. Young adults have children → high birth rate in cities
- 3. Improving healthcare → falling death rate
- 4. Births > Deaths = Natural Increase
Grade 8/9 Key Point
Urbanisation is NOT just migration! In many LIC/NEE cities, natural increase contributes 60%+ of urban growth. Examiners reward students who mention BOTH migration AND natural increase when explaining urbanisation.
Adjust migration and natural increase rates to see urban growth over time
% of rural population migrating to cities annually
Urban birth rate minus death rate
1.0M
Urban Population
4.0M
Rural Population
20%
Urbanised
Megacities: The Urban Giants
Megacity = an urban area with a population of 10 million or more
See how megacities have multiplied since 1950
2020
33
Megacities (10M+ population)
Largest cities:
- 1Tokyo (37M)
- 2Delhi (32M)
- 3Shanghai (28M)
- 4Mumbai (21M)
- 5Lagos (15M)
Key trend: Majority now in LICs/NEEs, Asia dominates
Click on a city to see population and growth rate
Growth Rate
Key Megacity Facts
- • 1950: Only 2 megacities (New York, Tokyo) - both HICs
- • 2020: 33 megacities - majority now in LICs/NEEs
- • 2030: Projected 43+ megacities
- • Asia dominates: Tokyo (37M), Delhi (32M), Shanghai (28M), Mumbai (21M), Beijing (21M)
- • Fastest growing: Lagos, Dhaka, Delhi (3%+ annual growth)
Case Examples
Lagos, Nigeria (LIC)
1950: 300,000 people
2020: 14+ million people
Growth rate: 3.5% per year
One of the fastest-growing cities in the world - doubling every 15-20 years
Mumbai, India (NEE)
1950: 3 million people
2020: 21 million people
Growth rate: 1.4% per year
Growth slowing as NEE develops, but still adding 300,000+ people annually
Exam Practice
Lagos, Nigeria (LIC) urban population grew from 300,000 (1950) to 14+ million (2020). Explain how BOTH rural-urban migration AND natural increase contributed to this extreme growth. [6 marks]
Test Your Knowledge
A country has 80% urban population, slow urban growth, and some people moving to rural areas. What development level is this?